The Broken Thermostat
Why Europe’s best solar resource has its worst solar economics — and what that says about market design
Evidence classes are marked throughout: [M] measured from public data, [C] computed with stated assumptions, [P] public accounts, [S] simulated (never load-bearing).
I.
Correction — 13 August 2026
What this essay claimed. That merchant solar is worst where the resource is best, and that Spain is the clearest case: “the fall in capture is steepest exactly where the resource is best”, “Iberia crosses first”.
What is now measured. Each zone is costed on its own basis rather than against one German-derived band, and the ranking does not hold. Against its own levelised cost, a merchant solar plant earns:
capture its own merchant LCOE shortfall vs annualised fixed cost Germany €46 €85 −46% Spain €36 €54 −32% Germany is further below its own cost line than Spain, not less. The reason is capacity factor: Spanish full-load hours are 1.6× German (1,433 vs 902), so the same capital buys considerably more output and Spain’s own LCOE is far below the €55–93 band this essay applied to it.
Why the error happened. A merchant cost band derived from German components was applied across zones. Capacity factor is an instance property, so an LCOE band is not transferable — and applying one silently misprices every zone it did not come from.
What survives. The thesis, undamaged: in every market measured, a merchant solar plant earns less than its levelised cost — Germany −46%, Spain −32%, California −75%. What does not survive is the ordering, and with it the “worst where the resource is best” framing.
A second correction, to the correction. The first version of this fix put Spain at −12%. It used a Spanish capacity factor computed against the model’s 28 GW fleet rather than Spain’s real ~36.5 GW, which inflated the capacity factor and overstated the correction by more than double. The figures above use grid-fed generation over grid-fed capacity. Spain still uses German capex, because no Spain-specific figure could be sourced; Spanish capex is plausibly lower, which would lower Spain’s LCOE further and widen the gap to Germany.
Every figure is reproducible from the replication repository.
A megawatt-hour of Spanish sunshine earns about €36.
That is not the Spanish wholesale price, which is considerably higher. €36 is what a merchant solar plant actually receives: the average price across the hours it happens to produce, weighted by how much it produces in each. Portugal earns €35. Germany — with roughly half Iberia’s irradiance — earns €46. [M]
The better the sun, the worse the economics.
That inversion is not a market failure. It is a market working precisely as designed, delivering a signal of unusual clarity: stop building solar here. The interesting question is why nobody has stopped.
II. Two prices
The number almost everyone quotes for a power plant is its levelised cost of energy — total lifetime cost divided by total lifetime output. LCOE has made solar’s case for fifteen years, and it made it honestly: the cost per megawatt-hour has collapsed.
But LCOE prices energy. Markets pay for energy at a time. Those are different goods.
It is worth being precise about what cannibalisation does and does not do, because it is easy to misread. It does not reduce a plant’s physical output. A panel produces the same kilowatt-hours whether or not its neighbours exist; LCOE’s denominator — lifetime megawatt-hours — is correct. What cannibalisation changes is the price each of those unchanged megawatt-hours fetches. LCOE is silent about that price. It divides lifetime cost by lifetime output and quietly assumes every megawatt-hour is worth the average one. In a solar-heavy market it is not: the plant’s own output is concentrated in exactly the hours its output has made cheap. (There is a second, physical channel — at high penetration a plant is sometimes curtailed, and then output does fall — but it is the smaller effect, and it arrives only after the revenue effect has already done its work.)
A plant’s economics therefore depend on the ratio between the two prices: the average price it captures divided by the average price in the market. Call it the value factor. A perfectly flat generator has a value factor of one, by construction. A generator whose output coincides with expensive hours earns above one; one whose output coincides with cheap hours earns below.
Make it concrete. Suppose a plant produces 1,000 megawatt-hours over a year, and the market averages €65/MWh across that year. If the plant were flat, it would earn €65,000. But its output lands in the cheap midday hours, and it actually captures an average of €36/MWh — €36,000. Its value factor is 36 ÷ 65 ≈ 0.55. The same electrons; two-thirds of the revenue. Nothing in the LCOE has changed. Everything in the business case has.
Solar’s problem is that it defines when its own hours are cheap. Every panel in a price-coupled market produces at the same time. Each new one adds supply to precisely the hours in which it earns, and to no others. It is the only technology that competes exclusively against itself.
III. The measurement
Across coupled Europe in 2025, the solar value factor is about 0.55. Wind is about 0.90. [M]
That gap is itself the result. Wind is dispersed in time and space — it blows at night, in winter, and rarely everywhere at once — so its output does not all pile into the same hours, and it cannibalises itself far more weakly. The 0.90-versus-0.55 spread is the temporal-dispersion effect, measured: the more concentrated a resource’s output, the more it depresses its own price. Solar has no such luxury. The sun rises across a continent within a couple of hours and sets the same way. (Whether wind’s mild cannibalisation becomes a binding problem at much higher wind penetration is a real and separate question — dispersion weakens the effect, it does not abolish it — but it is not the question this essay answers, and I leave it open rather than wave it away.)
The same measurement on a different continent: in the California ISO, the solar value factor is 0.525 — a different market design, a different fleet, a different regulator. [M] Two independently coupled systems, no shared institutions, the same number.
That is what a physical result looks like. Cannibalisation is not a European policy artefact. It is a consequence of simultaneity.
(A caveat stated plainly: our CAISO series covers about two thirds of 2025, and the missing months are the summer — the deepest duck curve, the lowest midday prices. Their absence biases the value factor upward. The California figures below are therefore an optimistic bound, and the conclusion holds a fortiori.)
IV. The mechanism, not merely the correlation
Solar’s value factor has fallen as solar has grown. Germany: 0.93 in 2019, 0.52 in 2025. Spain: 0.99 to 0.55. [M]
That correlation is worth very little on its own. European solar capacity grew across the same decade in which coal plants closed, gas prices convulsed, and demand structure shifted. Any of those could produce a declining line. Time is a confounder that swallows almost everything.
So here is a test that time cannot explain.
Take a single year — 2025 — in a single country. The fleet is fixed. Fuel prices are fixed. The rules are fixed. The only thing that varies from day to day is the weather. Now ask: does the amount of solar generated on a given day predict the gap between that day’s evening prices and its midday prices?
It does, and steeply. In Germany, each additional gigawatt of midday solar widens the evening-minus-midday spread by about €3.3/MWh (r = 0.76). On an overcast day the spread is roughly zero. On a bright one, ten gigawatts of midday solar opens a €33/MWh valley in the middle of the day. France shows the same relationship at €4.0 per gigawatt. [M]
Coal retirements do not vary with Tuesday’s cloud cover. Gas contracts do not reprice because the sky cleared. Demand does not restructure between one day and the next. The only thing that changed is how much sunlight reached the panels — and the price of the hours those panels sell into moved accordingly.
Solar does not merely correlate with the midday depression. It makes it, day by day.
V. You are cannibalised by your neighbours
There is a natural assumption that a country’s solar economics depend on how much solar that country has built. Across European zones in 2025, that relationship is essentially absent (r = −0.11). [M]
France explains why. French solar remains small — its share of domestic generation grew from about 1.5% to 5.7% over the period. By the local-cannibalisation story, French solar should have kept most of its value. Instead its value factor fell from 0.95 to 0.59 — nearly as far as Germany’s, on a fraction of the build-out. [M]
Regress value factor against continental solar share instead of domestic share and the picture resolves sharply: pooled across zones and years, r = −0.87 (−0.93 excluding the 2022 price crisis). [M]
In a coupled market, midday is midday everywhere. A French plant is not competing with French panels; it is competing with every panel inside the price-coupling perimeter. Spain’s build-out depresses France’s revenue, and neither country’s regulator is accountable for the other’s investment case.
This is worth stating carefully, because it is the part with real institutional consequences: the externality crosses the border, but the subsidy decision does not.
VI. The thermostat
None of this, so far, is a problem.
A market that pays generators the value of what they produce contains its own governor. Build solar; capture rates fall; new projects stop clearing their cost of capital; building slows; the remaining fleet’s capture recovers. The signal is unpleasant for whoever receives it, and it is exactly the signal a scarce-resource allocation system is supposed to send. It does not say stop building solar. It says stop building solar here, in this configuration, at this hour, until something changes — until storage arrives, or demand shifts, or interconnection deepens, or the fleet turns over.
That is a thermostat. It is supposed to switch the heating off when the room is warm.
And it is not only theory. We can watch the governor operate inside our own market model. Drive the model’s German solar fleet upward, gigawatt by gigawatt, holding everything else fixed, and the solar capture price falls monotonically — by about €0.4/MWh for every added gigawatt in Germany, and far more steeply in sun-rich Spain, where ten gigawatts roughly halves it — because the midday valley the model digs deepens exactly as the measured one does. [S] That downward response is the mechanism, reproduced by an engine that was never built to have one: validation against economic theory rather than against the same data the headline uses.
What the engine gets right is the slope; what it gets wrong is the level. Its capture prices sit well above the meter — Germany €68 modelled against €46 measured, Spain €50 against €36 — the same optimism Section IX documents, because its price distribution is too narrow. So we do the honest thing: take the structural response (the slope) from the model and the level from the meter, anchoring each zone’s curve to its measured capture at today’s fleet. Both curves are drawn in the figure, so the correction is visible rather than hidden. Anchored, the reading is stark. Lay across it the cost line an unsubsidised investor faces. That line is not one band shared across zones — see the correction above — because capacity factor sets it and Spanish full-load hours are 1.6× German. Costed separately, Germany’s merchant LCOE is about €85/MWh and Spain’s about €54, against a quoted contracted €41–69 lifted by the cost-of-capital premium of Section IX. In both zones the capture price is already below that zone’s own cost line at today’s installed capacity — Germany by 46% of its annualised fixed cost, Spain by 32%. The thermostat’s set-point is not somewhere ahead of us at a future penetration; on the measured level it is behind us. This is not a forecast of how many gigawatts. It is a demonstration that the governor is real, drawn from our own architecture without disclosing a line of it.
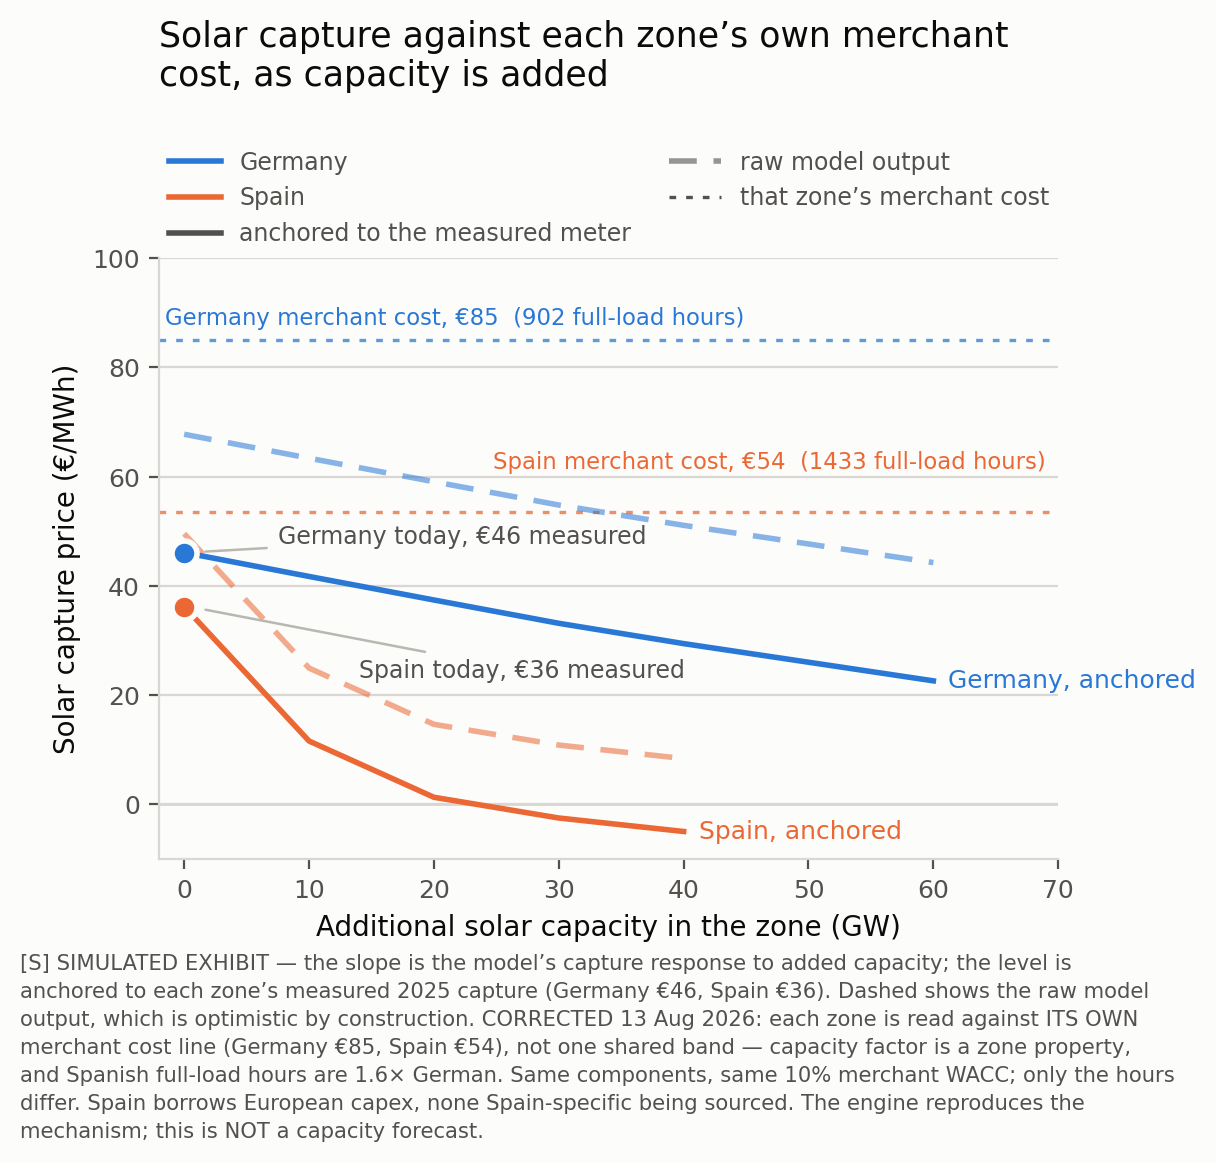
[S] Simulated exhibit. The slope is the model’s capture response to added capacity; the level is anchored to each zone’s measured 2025 capture. The dashed curves are the raw model output, optimistic by construction — shown so the correction is visible rather than hidden. The engine reproduces the mechanism; this is not a capacity forecast.
VII. What we built instead
Now put the two halves together.
Across every market measured, a merchant solar plant earns less than its levelised cost — but by how much is only meaningful once each zone is costed on its own basis. Spain at €36 sits 32% below its own merchant LCOE of about €54; Germany at €46 sits 46% below its own €85, the worse of the two, because German output per installed kilowatt is 1.6× lower. California at $17 against a US-costed $67 is furthest of all at 75% — though that last comparison is not strictly like-for-like, since US capital costs are quoted on a different basis from European ones and the gap between the two conventions is not yet resolved. [M] [C]
And yet solar is being built at record pace in all three places — 2024 was the largest solar deployment year in history in Europe, the United States and worldwide, on the industry’s and the agencies’ own accounting. [P]
It is built because almost nobody building it is exposed to the price it just measured. In Europe, feed-in premiums and contracts-for-difference pay the difference between the market price and a strike price — per megawatt-hour produced, irrespective of when. In the United States, tax credits and long-term offtake do comparable work. In the Gulf, utility solar sells at $10.40 to $13.50/MWh under fixed-price PPAs. [P] Those Gulf numbers are extraordinary, and they are routinely quoted as the frontier of solar cheapness — but they cannot be set against a capture rate at all, because these markets have no liberalised merchant spot market for the plant to be exposed to. There is no hourly price to capture, no value factor to fall. That is not a gap in the comparison; it is the comparison. Where there is a merchant price, solar’s revenue is cannibalised; where solar looks cheapest of all, there is no merchant price to be cannibalised by. The cheapness and the insulation are the same fact seen twice.
Cannibalisation risk has not been abolished anywhere. It has been moved. In the Gulf it sits with the offtaker. In Europe it sits with the taxpayer. And the party now holding it is, in every case, the party with no ability to respond to it — a treasury cannot decline to build a plant, and a state offtaker cannot resite one.
The thermostat is still measuring the room correctly. We have simply disconnected it from the boiler.
VIII. The same mechanism, one clock slower
Readers of the first essay in this series will recognise the shape — but it is worth being exact about how the two pieces relate, because it is not that one is theory and the other practice. Both are measurements of the same institution from a different decision horizon. The first essay looked at the dispatch horizon: what a plant does hour to hour, and whether the price it faces in a given hour reaches it. This essay looks at the investment horizon: whether a plant should be built at all, and whether the multi-year revenue signal reaches the party deciding. One institution, two clocks — the fast one that governs running, the slow one that governs building.
There, the finding was that German prices went negative in 576 hours of 2025, and that roughly €2.1 billion [€1.3–3.1bn] was paid to solar generators across those hours — with the large majority (about 86 percent, on a pre-registered 68-to-94 percent band) flowing to the pre-2016 stock that the legislature’s own repairs were written to spare. [M] [C] The price said stop producing. The contract said produce anyway.
There is one more asymmetry between the two horizons, and it sharpens the first essay rather than this one. At the dispatch horizon the production-linked premium does not merely insulate the plant from the negative price; it helps create it. A plant guaranteed €60/MWh above the market will rationally bid down to −€60 and keep producing, because the subsidy more than covers the loss — so the subsidised fleet actively pushes the price below zero. That is distortion plus insulation: the design both deepens the bad hour and deafens the producer to it. At the investment horizon studied here, there is no equivalent distortion — a subsidised plant does not make Iberian sunshine more simultaneous. This essay is the cleaner of the two cases: insulation alone, no distortion, and the mechanism still fails.
That symmetry is the argument. The problem was never that renewables are subsidised. It is that they are subsidised per unit produced, which is the one design that systematically blinds the recipient to when production is worth anything.
IX. A robustness check, and an uncounted subsidy
Two things could be objected to the measurement. Both, when checked, push the case the same way.
The first is that the result might be an artefact of some peculiarity of the data — that a proper market model, with cross-border coupling and a full merit order, would wash the cannibalisation out. So we ran exactly that test: we asked whether a full coupled-market model would flatter this conclusion. It would — by about €9.5/MWh. Our own engine returns solar value factors roughly 0.11 higher than the measured ones, because its price distribution is too narrow and it under-represents precisely the midday collapse being measured. [S] In other words, the more machinery you add, the kinder the number gets to solar; the raw meter is the adverse one, and everything above uses the meter. A model would not rescue the investment case. It would inflate it, and we can say by how much.
The second is subtler, and it runs through the cost side. The LCOE figures quoted by Fraunhofer ISE and Lazard assume contracted revenue, and therefore a low cost of capital — in the region of 4–6% real. But that low cost of capital is not a fact of nature; it is a product of the support scheme. A contract-for-difference or a fixed-price PPA is what lets a solar developer borrow cheaply, precisely because it removes the price risk this essay is about. A genuine merchant developer — one actually bearing the cannibalisation risk — is financed nearer 8–12%. For an asset whose cost is almost entirely upfront capital, LCOE scales close to linearly with the discount rate, so the merchant plant’s true cost line sits roughly a third above the published one. [C]
Read those two together and something awkward appears. The support scheme lowers the quoted cost of capital, which lowers the quoted LCOE — so part of solar’s headline cheapness is itself a subsidy effect, and it is one that never appears in any subsidy account. The famous falling-cost curve is measured at a discount rate the subsidy created. Strip the scheme out and both blades of the scissors move: the revenue is lower than the model says, and the cost is higher than the LCOE says. The comparison in Section VII — an optimistic revenue against an optimistic cost — is conservative on both sides. The real gap is wider than stated.
X. Objections
“This is just the market working. Cannibalisation will stop the building by itself.” It would — if the signal reached anyone able to act on it. It doesn’t, and hasn’t, for a decade. The party receiving the poor capture price is a treasury or a state offtaker with no incentive, and often no mechanism, to change the investment behaviour in response. A self-correcting loop whose corrective signal is delivered to a party with no reason to correct is not self-correcting. The brake works in theory; it has been unbolted from the wheel.
“Costs are still falling. Capture can fall too.” True, and it is why this is a question of relative slopes rather than levels. The fall in capture is indeed steepest where the resource is best: the meter puts Spain at €36, and the engine, anchored to that level, has it collapsing to about €12 with a further ten gigawatts and to essentially nothing with twenty — by far the steeper of the two zones we swept. But the crossing does not follow the same order, and this essay originally claimed it did. Both zones have already crossed their own cost lines, and Germany has crossed by more — 46% below its own LCOE against Spain’s 32% — because Spain’s superior resource lowers its cost line as well as its revenue. The mechanism is confirmed; the “best resource crosses first” corollary is not. Sunshine cuts both ways, and the original text counted only one of them.
[S] Same exhibit as Section VI, repeated here for the Iberian claim. Slope from the model, level from the measured meter; not a capacity forecast.
“Storage will solve it.” Storage does not remove the spread; it monetises it. And the widening midday valley measured in Section IV is the storage investment signal, arriving with unusual clarity. The question this essay raises is whether our rules let anyone act on it — because the same production-based payments that blind solar to the hour also suppress the very price differences storage would live on. (Whether a production-neutral scheme actually summons more storage is itself testable in the same engine used in Section VI; that is a subject for the sequel, not a claim here.)
“This is an anti-renewables argument.” It is the opposite. A production-neutral support scheme builds fewer panels in the same orientation at the same latitude and more of everything that makes the system work — east and west orientation, storage, flexible demand, interconnection. The current design does not build more renewables. It builds more of the most cannibalised ones.
XI. Does production-linked support survive its own success?
It is fair to ask why solar should be supported at all, if — as Section VI argues — a working price signal plus a collapsed LCOE would do the job. The honest answer is that there were three distinct reasons, and they have not aged alike.
The first was learning-by-doing: subsidise deployment now to drive the cost down the experience curve for everyone later. That reason was excellent and it is now largely spent — the cost has collapsed; the learning has been bought. The second is the carbon externality: fossil generation is underpriced because its damage is unpriced. That reason is real and permanent, but it is an argument for pricing carbon, not for paying per solar megawatt-hour — a carbon price rewards any decarbonisation, including the storage and flexibility the current scheme starves. The third is target commitment: a state that has legislated a build-out may want to de-risk it regardless of the market case. That is a legitimate political reason, but it is a reason to hit a capacity target, not a reason to blind the fleet to price — and it can be met with availability-linked or capacity contracts that leave the hourly signal intact.
So the framing that matters is not how should we design support but does production-linked support survive its own success. It was built for an era of expensive, marginal solar that needed coaxing into existence. It now governs an era of cheap, abundant, self-cannibalising solar — and in that era the very instrument that summoned the fleet is what stops the fleet from ever facing the signal telling it where to stop. The design outlived the problem it solved and became the problem it perpetuates.
Three things follow. Reward availability rather than production — capacity- or availability-linked contracts leave the hourly signal intact and let a developer who tilts panels west, or adds two hours of storage, keep what that decision earns. Price the externality where it is created — cannibalisation is continental while support is national, so a member state currently exports the revenue consequences of its build-out to its neighbours and pays nothing for it. Make the spread capturable — if the midday valley is the signal, the rules should let storage, electrolysis and flexible load monetise it without being competed against by capacity paid regardless.
One thing does not follow, and I flag it rather than argue it here. In work still to be published, we decompose the gap between European and US/Gulf delivered industrial power prices and find the large majority of it institutional — addressable by exactly this kind of reform — and a stubborn remainder structural: a firming premium no pricing rule can touch. Reform can fix what design broke; it cannot fix a seasonal wind lull. That decomposition is the subject of a later essay, once the theory here has been laid down and can be applied to it.
And there is a nearer test coming. Germany is about to subsidise large-scale grid-balancing batteries through fixed-contract mechanisms of exactly the production-linked family examined here. If the argument of this essay is right, the same disconnection will reappear one storage layer up: a payment that rewards the asset for existing rather than for arbitraging the spread it was built to arbitrage. That is the next essay’s question, and it is why this one had to establish the mechanism first.
The honest claim is narrower than the usual one and, I think, more useful. Europe’s power market is not failing to send the right signal. It is sending it clearly, repeatedly, and at increasing volume — €33 of midday depression per ten gigawatts of sunshine, day after day — into an institutional structure specifically built to ensure that nobody who could act on it ever feels it.
Sources and method
All headline capture rates are computed from realised day-ahead prices and generation published by ENTSO-E (Europe) and CAISO OASIS with EIA-930 (California); no model output is used for any headline figure. Value factor is generation-weighted mean price divided by time-weighted mean price over the calendar year. The Section IV daily test uses a single year with fixed fleet and fuel prices, regressing the evening-minus-midday spread on that day’s midday solar. LCOE: Fraunhofer ISE (July 2024) for Europe, Lazard LCOE+ (June 2024) for North America; Gulf PPAs from published tender awards. The record-deployment claim in Section VII rests on SolarPower Europe, IEA and EIA 2024–25 reporting. The equilibrium curve in Section VI and the model comparison in Section IX use our own coupled market model, whose price dispersion is known to be understated — a bias that works against this essay’s conclusion, and whose size (≈ 0.11 of value factor, ≈ €9.5/MWh) is stated. The curve takes only the slope (the capture response to added capacity) from the model and anchors the level to each zone’s measured 2025 capture; the raw and anchored curves are both shown. The CAISO series covers roughly two thirds of 2025 with the missing months concentrated in summer, biasing the reported value factor upward. Replication code and data references accompany this essay.